Camelot-MC_white logo

Data Literacy: Why Is It Needed?

05.10.2021

Data Literacy

Reading Time: 4 Min.

Share

Our modern world produces a rapidly increasing volume of information of all kinds. In 2011, 1.8 ZB (Zetta Byte) had been generated, in 2015 the amount of data summed up to 8 ZB already, and in 2020 we look at over 40 ZB, that is 40,000,000 Petabyte [see researchgate]. This is the data that is newly generated, processed and distributed worldwide. With this, the new millennium is becoming the age of data. Advances in the chip and networking technology provided the basis for exponential growth in performance and speed in all IT-based systems.

The most tangible example comes from the private sector. At the turn of the millennium, for example, a digital camera had a resolution of 640 × 480 pixels; today, they capture more than 20 million dots per image, so that one vacation can create as much as 20 gigabytes of data. Images from medical devices or satellites have experienced comparable increases in dimension over the years, too.

Added to this is the progressive networking of all devices and the digitalization in all areas of life. In order to be able to manage this growing flood of data in all its complexity, comprehensive data literacy is required from more and more roles.

What Is Data Literacy?

Data literacy is the ability to read data, work with data, and communicate about data by putting it in the right context. It is more than just understanding and working with numbers, i.e., numeracy. Data literacy involves understanding:

  • How to evaluate data sources and collection methods?
  • What are the different applications for a given data set?
  • The value of working with understandable data?


Figure 1: Data Literacy


Why is Data Literacy Important for Businesses?

Despite ever-increasing spending on Big Data and analytics products [see globenewswire], research shows that 50% of companies will still not have the necessary data skills and AI capabilities to achieve their set goals [see Gartner]. It is irrelevant how much data a company collects, if it cannot be put to good use. For our topic that means: Data must be enriched and visualized to me meaningful and helpful.

Data literacy is one of the most relevant data management topics for the 21st century, laying the foundation for an organization’s momentum and success. It is important that everyone in an organization understands why it is important to improve data literacy. Employees should be able to use data be informed both their daily activities and far-reaching decisions. Whether it’s the purchasing department reordering inventory or the sales manager placing a product with the customer. When used properly, it can help every employee achieve their goals, do their jobs better, and contribute to the overall performance of the organization.

How Can a Data Visualization Help Understand Data?

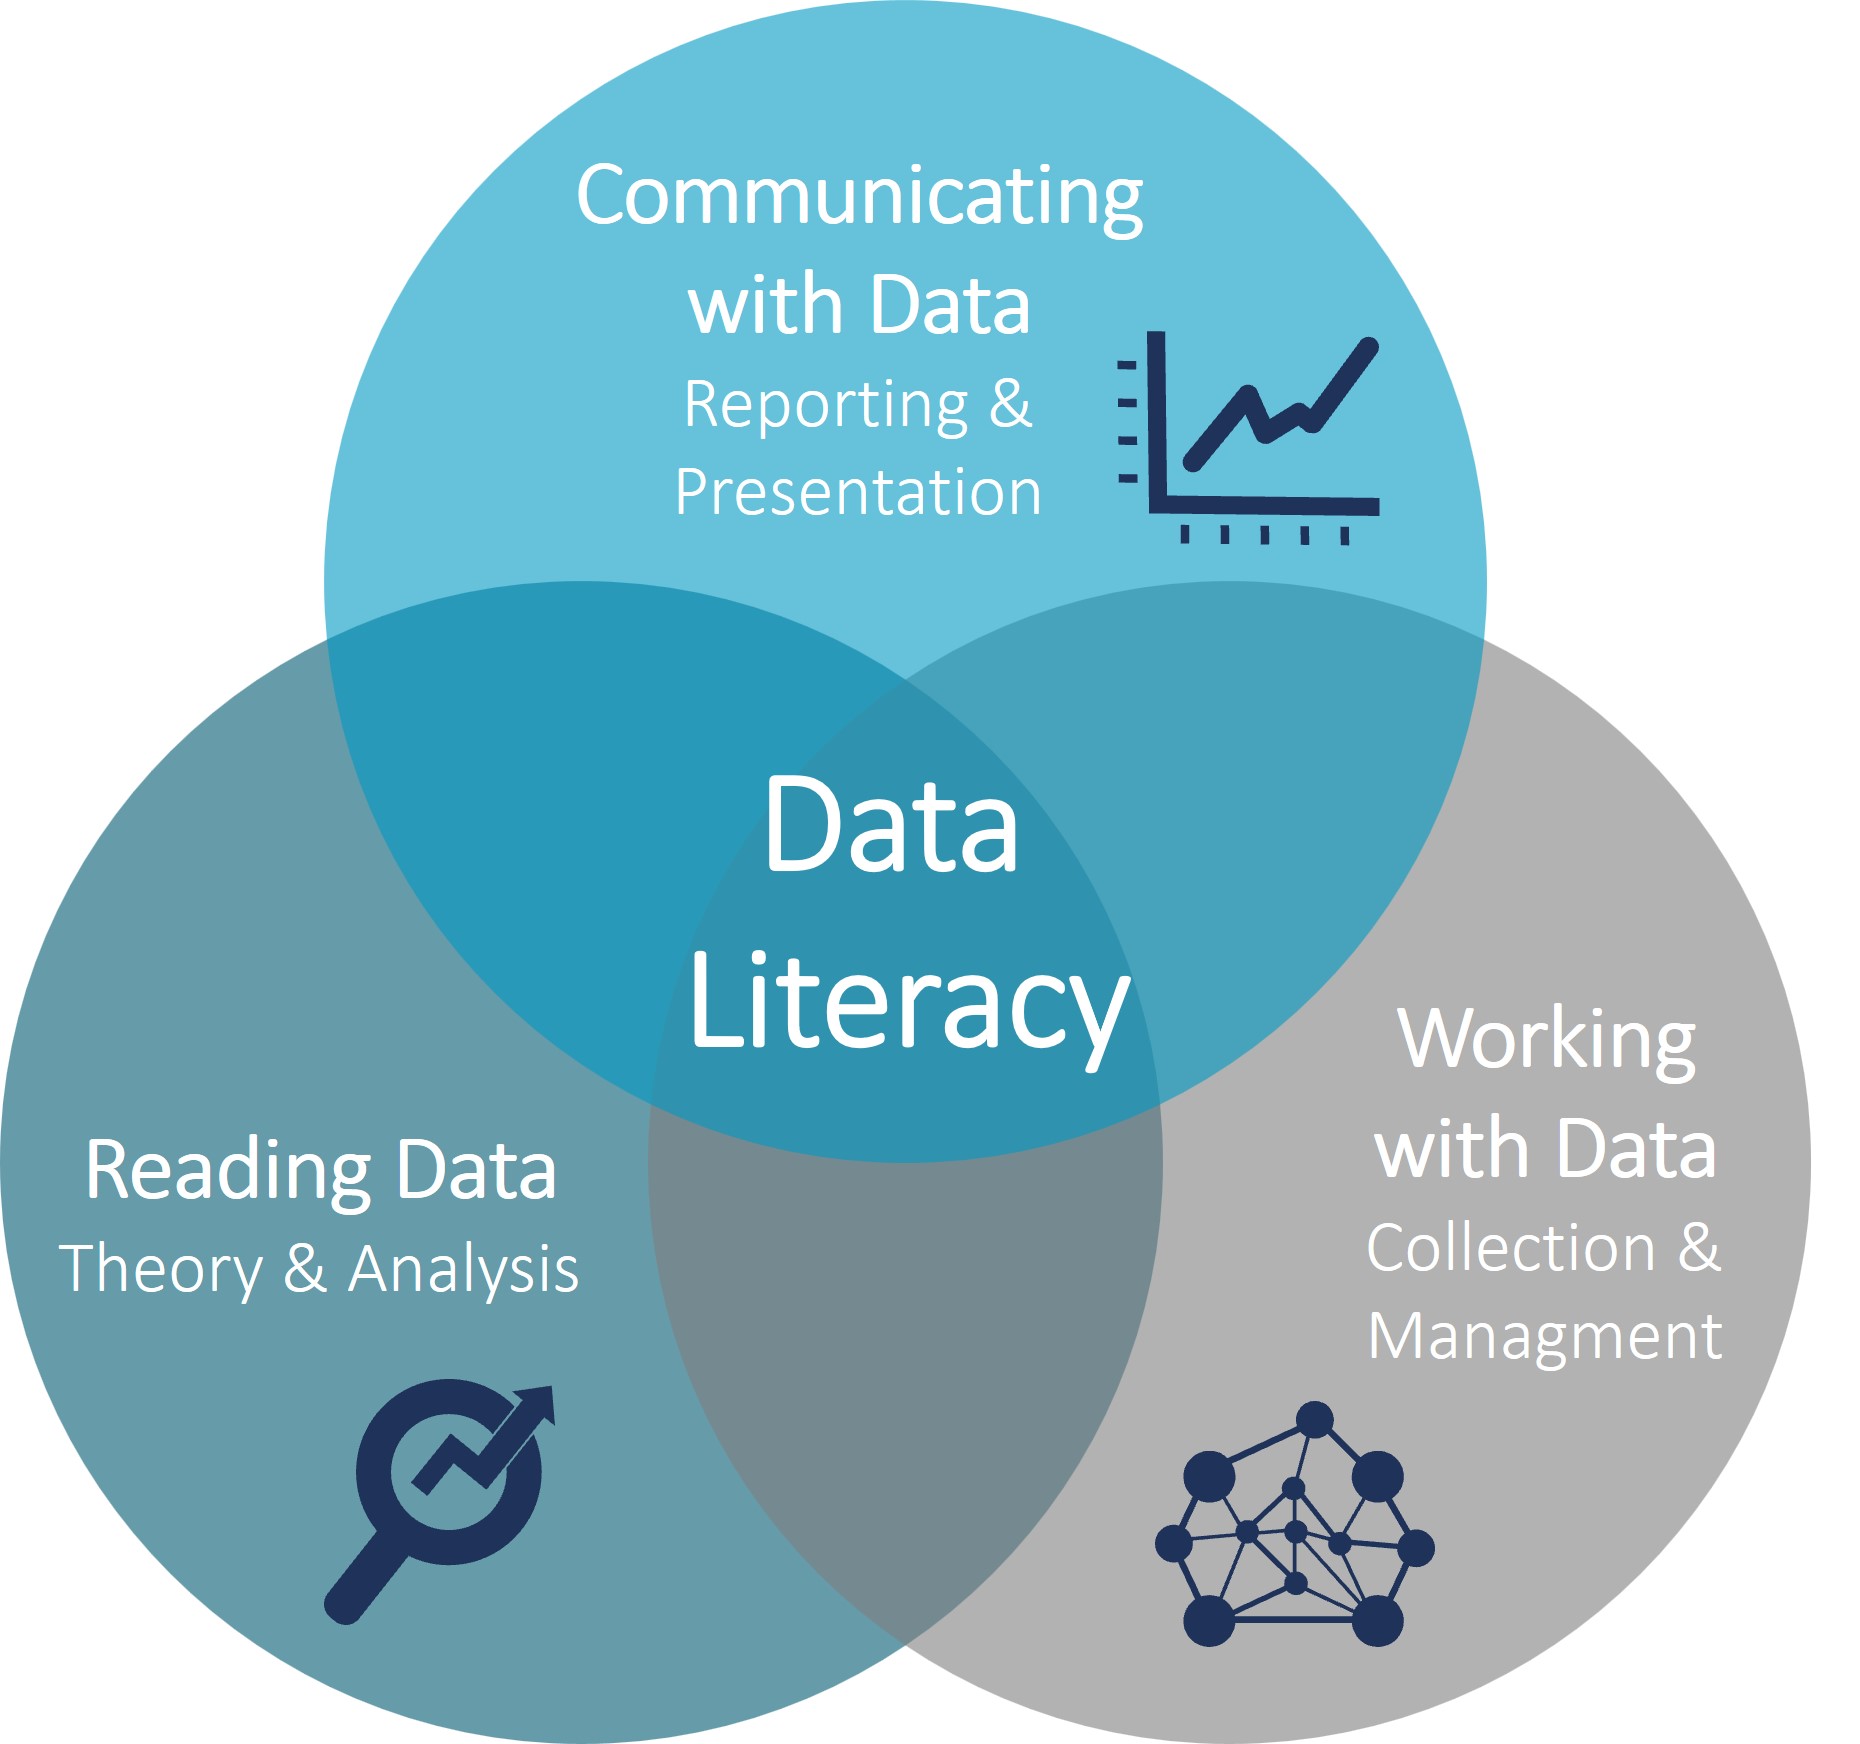
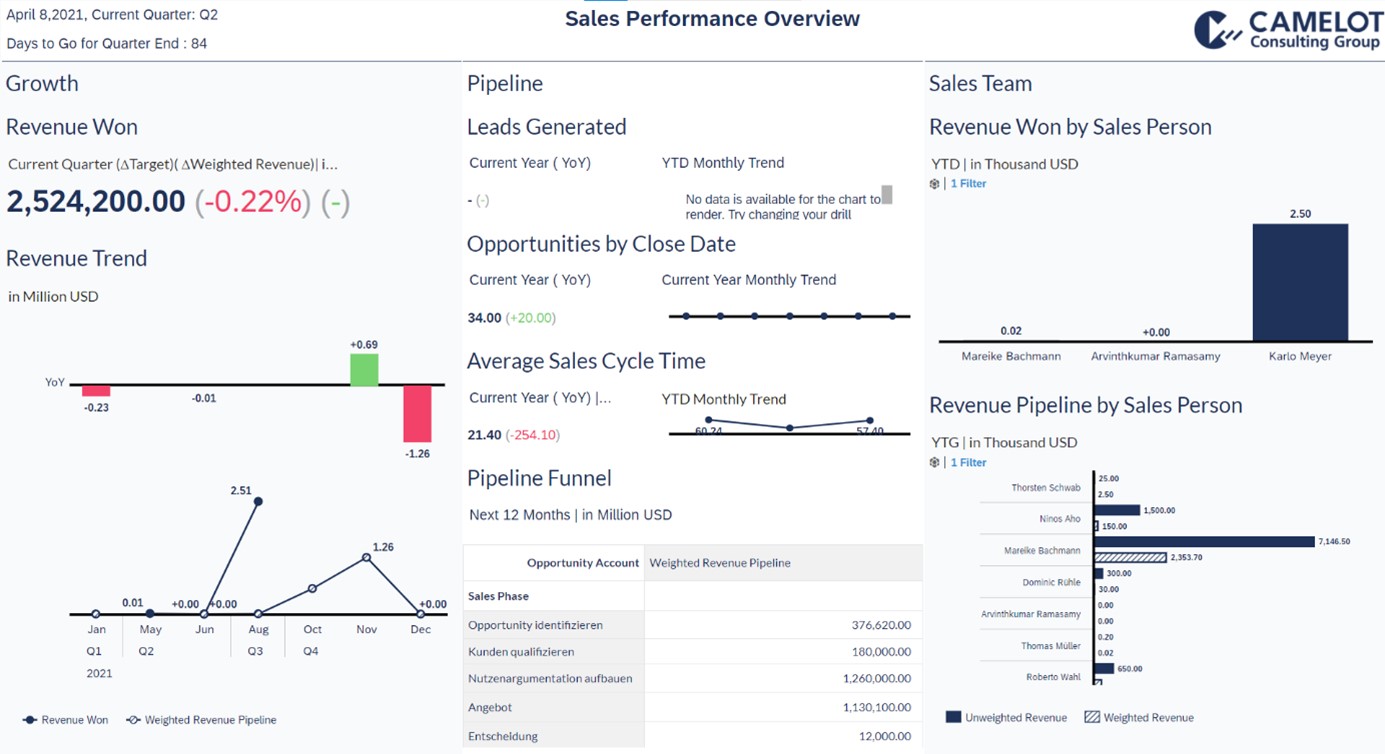
Plain numbers are hard to read and even harder to interpret. This is where data visualization comes into play. Data visualizations help translate numbers into meaningful insights, enabling all stakeholders to derive maximum value from the data. True to the motto “a picture is worth a thousand words”, the visualization of a data set can convey the information to be communicated much more quickly, efficiently and clearly.

Figure 2: Data Literacy Data Visualization

The awareness is steadily growing, that data literacy is becoming more and more important. Comprehensive data literacy will be a requirement towards many stakeholders even in non-technical roles. While the specific knowledge is not yet established at an individual level, data-driven leaders play their part as translator and facilitator.


Additional information

This article details how data literacy affects different roles within an organization.

If you want to know how Camelot implements data visualization projects, feel free to contact our data and analytics experts. We can help by providing a neutral assessment and selection of a visualization tool and design and concept your first data visualizations.


We would like to thank Geron Keller for his valuable contribution to this article.

Latest Blog Posts