
Risk & Resilience in Logistics Network Design
Reimagine resilience and proactively minimize supply chain risks


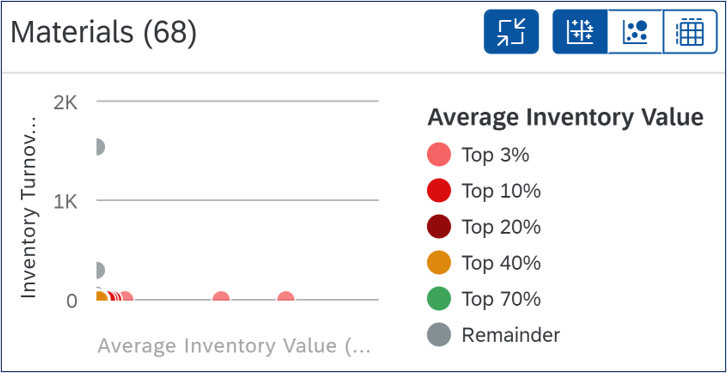
For broad product portfolios, planners need support regarding the questions on which products to focus. The inventory turnover analysis app provides a list of products with a low turnover and allows for further segmentation.
Inventory turnover is shown in relation to the average inventory value for a material (calculated as average stock quantity weighted with the current price). The focus should be on products with low turnover and a high inventory value as they hurt the working capital the most.
Once the main troublemakers are identified, a root cause analysis must be executed to understand the drivers of low inventory turnover. To support this, the app allows to display inventory turnover in relation to the coefficient of variance of goods issue.
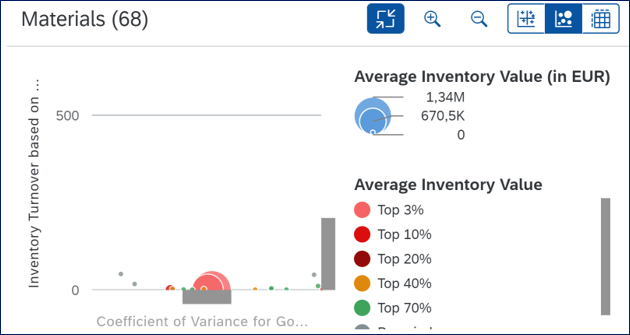
A high demand variability (especially if the demand is difficult to forecast) is one of the primary factors driving inventory turnover as it makes it harder to maintain the right amount of inventory. Therefore, it can be interesting to look at the products which do have a low turnover despite a low coefficient of variance (i.e. stable demand). For those products, the driver of inventory must be something else. The app also provides information on lot sizes, safety stock settings, delivery cycles, and suppliers. Based on this, planners can derive the root cause for the low inventory turnover and define countermeasures.
Regarding the limitation of the app, it needs to be mentioned that the inventory turnover (in days) is calculated as sum of goods issues during a historical period over average stock quantity and therefore, backwards looking. This requires the planner to add additional information from other sources (e.g. future demand) to see the full picture. In addition, a comparison between different storage locations is not possible.
This app is not tailored for the day-to-day usage and steering of operational business, but for a regular analysis of inventory drivers and to derive more tactical measurements (e.g. adjust stock parameter settings or change of supplier). If planners are trained to use the displayed information and interpret it in a meaningful way, this app can be useful in supporting the journey towards more balanced inventory and optimized working capital.
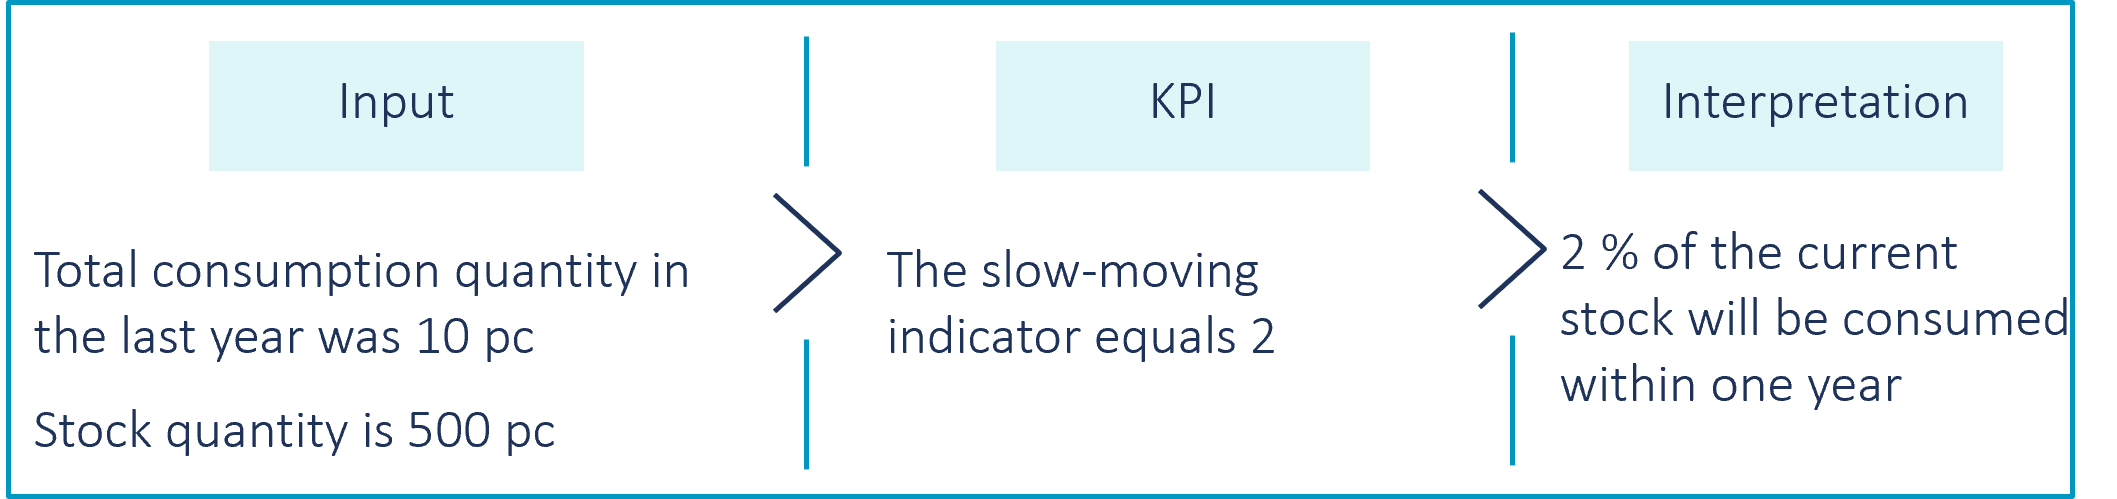
Slow or non-moving stock refers to inventory items that have low or no consumption over a specific period. If this part of inventory is not analyzed on a regular basis, there is a risk of obsolete materials SAP S/4HANA’s Slow or Non-Moving Materials app provides capabilities to monitor and investigate the slow or non-moving materials in stock. The app delivers a forecast of how fast the stock will be consumed in the future based on historical consumption. A slow-moving indicator informs which percentage of the current stock will be consumed within one year. The lower the indicator, the slower the material is moving.
There is a limitation in the logic of this app. To have a complete understanding about the risk related to slow-moving stock, future consumption might be decisive to predict the right consumption and therefore, future stock level. Considering only historical consumption and not future demand makes the analysis not complete and requires checking separately also the expected demand input. This will be quickly identified by practitioners as a significant weakness of this app as it forces the material planner to use additional sources of information to check if the non-moving material is, for example, part of a planned phase-in operation.
Although the app relies on historical data, it still supports the reduction of slow or non-moving inventory if enriched with other information and planners’ intelligence. The granular view in the app empowers planners to make informed decisions to combat inventory stagnation and plan follow-up actions such as stock transfers, adjustment of target stock levels, price reductions to stimulate demand, or scrapping of obsolete items to free up space and resources.
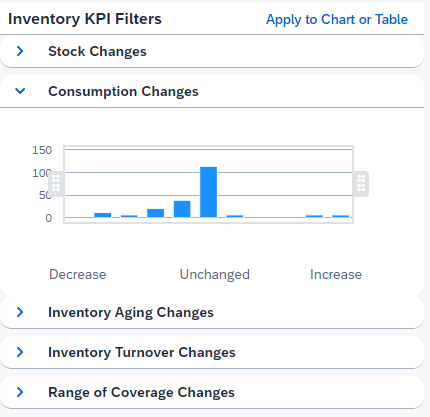
In a dynamic business landscape, monitoring and analyzing crucial inventory performance indicators (KPIs) contributes to informed decision-making. This need is met in S/4HANA by the Inventory KPI Analysis App.
The app keeps an eye on five KPIs and allows to track their development during a certain period of time. Therefore, a reference date (e.g. today) and aggregation level (e.g. two years in months) must be chosen to define the comparison period (e.g. in this case, the last two years in monthly buckets while January of the previous year is compared to January of this year). Depending on the business requirements, the app’s limitation to only three predefined aggregation levels might require planners to export this data into an Excel file for further processing.
1. Stock Level: This metric indicates the current value of inventory and displays the stock value changes compared to a reference period. While this is helpful, it has to be noted that only the value but not the quantity (e.g. in base unit of measure) is displayed. This is restricting since for many discussions, the leading unit of measure inside the supply chain is quantity or volume given in relevant units.
2. Consumption Level: Similar to the stock level, the consumption of materials is also tracked and can therefore be displayed over time. This allows the depiction of changes with respect to a reference period.
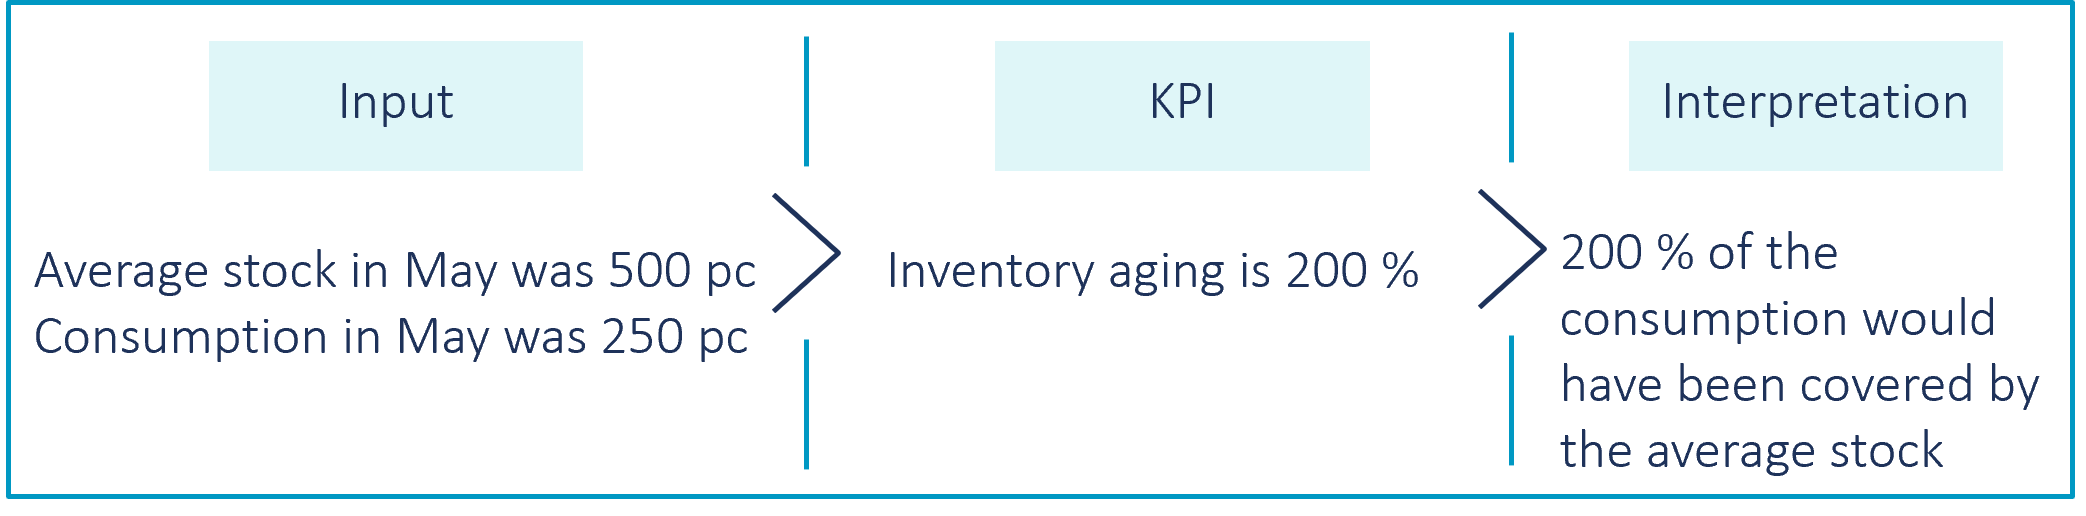
3. Inventory Aging: This metric provides information on how long the material is stored, given the average stock and consumption in that period.
4. Inventory Turnover: It indicates how often the material is used up and restocked to foster efficient ordering strategies.
5. Coverage: Indicates how long the current stock on hand would last, given the consumption in a historical reference period. Again, the limitation of only looking at past consumption will force supply chain professionals to enhance the analysis with further input on expected future consumption to not overlook upcoming significant changes in the stock levels.
Noteworthy is the way the filters for the KPIs are set up. For the materials selected, it is displayed how many of those decreased, increased, or remained stable. This allows to quickly filter the outlier behaving differently than the rest of the portfolio.
With stock and consumption patterns as well as inventory turnover, the app provides the most relevant KPIs regarding inventory and allows very quickly to detect outliers. While the basic requirements regarding inventory management KPIs are covered, there will be additional information or tools required to come to a conclusive picture or a best practice inventory analysis level.
Reimagine resilience and proactively minimize supply chain risks

This article shall help you to understand how to optimize your inventory positions in a month – or even less.

Modern PLM systems empower businesses to achieve product excellence in fast-paced markets by enhancing collaboration, agility and innovation.

Read how the Campaign Planner & Designer (CPD) helps you to manage supply chain variability.
